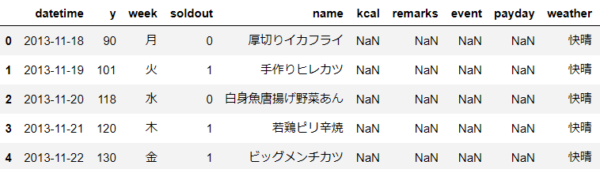
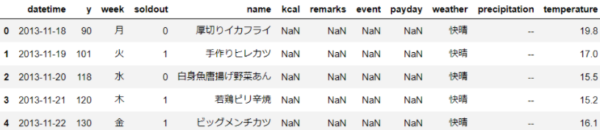
データの確認
df.head()
apply関数
# 1)datetimeから年を取得して、yearという項目を追加する(spilitで-毎に分割して、一番最初)
df["year"] = df["datetime"].apply(lambda x : x.split("-")[0])
# 2)datetimeから月を取得して、monthという項目を追加する(spilitで-毎に分割して、2番目の値)
df["month"] = df["datetime"].apply(lambda x : x.split("-")[1])
# 3)datetimeから日を取得して、dateという項目を追加する(spilitで-毎に分割して、3番目の値)
df["date"] = df["datetime"].apply(lambda x : x.split("-")[2])
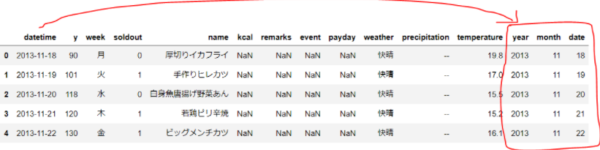
# データの確認 以下のようにyear, month, dateが追加されているのがわかる
df.head()